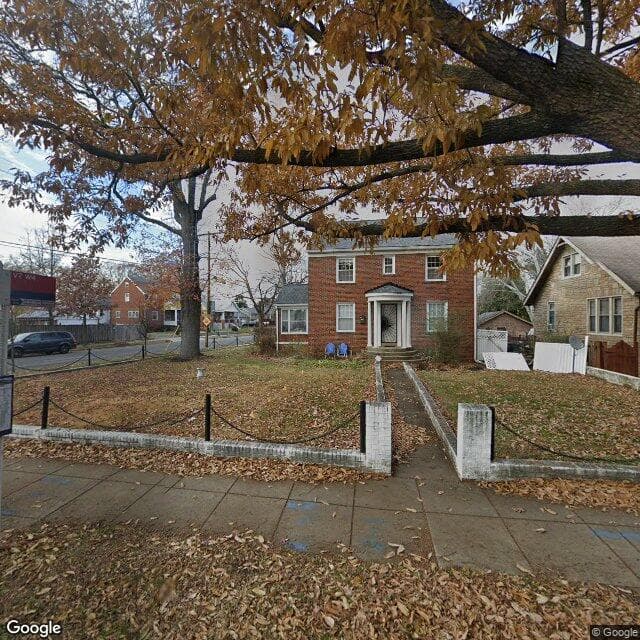
3200 Alabama Ave SE
Educational Use Only — NOT an appraisal or professional advice. — NOT professional advice. See terms
Property Overview
Price Analysis
How the list price compares to AI estimate
List Price
$550,000
AI estimates this property's value between $525,000 - $575,000 based on comparable sales and condition (Confidence: 80%). Educational analysis only, not a professional appraisal or valuation.
Market Data Points
3 data points for educational exploration
*Educational market data analysis only. Consult licensed real estate professionals for negotiation strategies and market advice.*
Offer Analysis
AI-generated starting point for educational purposes
AI Suggested Starting Point
Targets the lower end of recent sale outcomes observed between $525,000 and $575,000.
How This Was Calculated
Reflects market conditions, needed repairs, and seller motivation. The offer is competitive yet accounts for necessary investments.
AI-generated educational analysis. Not professional advice, an appraisal, or a recommended offer. Consult licensed agents and attorneys for negotiation strategies.
*AI scoring for educational purposes only. Scores are subjective and not professional evaluations. Consult licensed professionals for property assessments.*
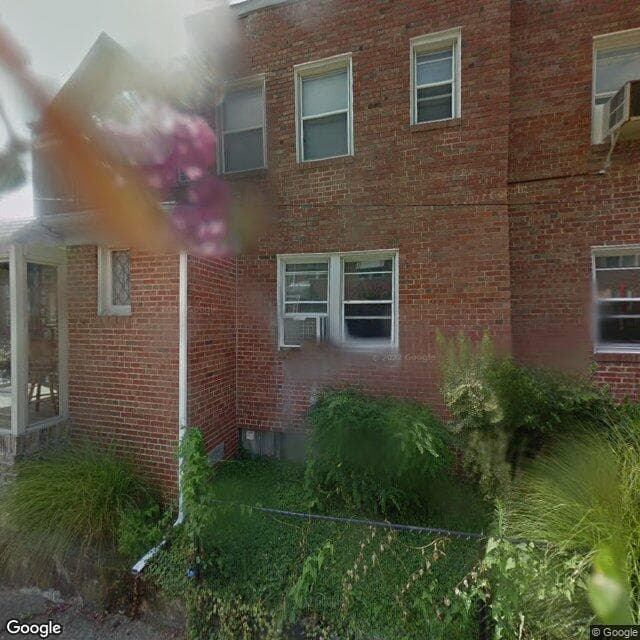
Visual Insights
AI-analyzed spaces with reimagining capabilities

Cracked Driveway
The driveway shows cracks and uneven surfaces, indicating potential need for repair or replacement.
Dated Garage Doors
The garage doors appear dated and could benefit from replacement to improve curb appeal and security.

Brick Staining
The brick on the house appears to have some staining or discoloration in areas, suggesting potential need for cleaning or maintenance.
Renovation Assessment
Prioritized renovations based on property inspection and market impact.
High Priority Renovations
No required renovations identified
Note: these are rough estimates. For more accurate estimates, please contact a professional.
Ownership History
Previous ownership changes and transaction details
Pricing History
Historical pricing trends for this property
Monthly Costs
Interactive breakdown of estimated monthly expenses
Upfront Transaction Costs
Estimated costs due at closing, including down payment and fees
* Estimated costs based on typical rates. Actual costs may vary by location, lender, and transaction details.
** Buyer agent fees are negotiable and may sometimes be covered by the seller.
Buyer Power Index
*Market analysis for educational purposes only. Historical data may not predict future performance. Consult real estate professionals for market guidance.*
Price Trajectory
Historical price trends for educational purposes only. Past performance does not predict future results. Consult professionals for market forecasts.
Historical Market Pulse
Key metrics over time, revealing market momentum and patterns
Negotiation Insight
Home sales decreasing 40.2% over the past 3 months suggests growing buyer leverage.
Subject Property
Stats in the Area
Based on 6 comparable properties nearby
Average Price
$481,566
Your price is 14.2% above average
Median Price
$535,000
Based on 6 recent sales
Price per Sq.Ft
$209
Your price is 10.5% above average $/sqft
Comparable Properties
| Address | Price | Sq.Ft | Beds | Baths | $/Sq.Ft | Sale Date |
|---|---|---|---|---|---|---|
| 3541 HIGHWOOD DR SE, WASHINGTON, DC 20020 | $535,000 | 2,354 | 4 | 2 | $2271.6% | 6/11/2025 |
| 3512 CARPENTER ST SE, WASHINGTON, DC 20020 | $539,000 | 2,214 | 3 | 2 | $2435.4% | 5/8/2025 |
| 2511 PALMER PL SE, WASHINGTON, DC 20020 | $505,000 | 2,242 | 3 | 2 | $2252.5% | 3/6/2025 |
| 2005 NAYLOR RD SE, WASHINGTON, DC 20020 | $275,000 | 2,000 | 2 | 2 | $13840.5% | 4/7/2025 |
| 2901 HILLCREST DR SE, WASHINGTON, DC 20020 | $635,000 | 2,510 | 3 | 3 | $2539.5% | 7/18/2025 |
| 1711 HIGHWOOD PL SE, WASHINGTON, DC 20020 | $400,393 | 2,421 | 3 | 3 | $16528.4% | 4/30/2025 |
Schools
Nearby school quality by education level
Elementary
Middle
High
Neighborhood Mobility
How easily you can get around with or without a car
Walk Score®
Somewhat Walkable
Score measures pedestrian-friendliness based on distances to amenities.
Scores are out of 100. Higher scores indicate better accessibility. Data provided by Walk Score®.
Climate Risks
Assessment of climate-related hazards for this property
Major Risk Profile
This property has 0 severe, 1 major, and 3 moderate risk factors
Climate risk data is based on historical patterns and projections. Consider consulting with insurance providers and local experts for property-specific assessments.
Sunlight Analysis
Data provided by Shadowmap
Loading sunlight data...
Educational Tour Ideas
Educational suggestions for property tours
Inspect the basement (if any) for signs of water damage, mold, or musty odors.
Thoroughly inspect the roof for missing, damaged, or curling shingles. Pay close attention to flashing around chimneys and vents.
Inspect the heating system (radiators) for rust, leaks, and proper operation. Ask the agent to turn on the system, if possible, to check for functionality.
Walk the perimeter of the property, paying attention to the foundation. Look for cracks, settling, or signs of water damage.
Educational Questions
Sample questions for educational purposes
Can you provide any documentation regarding the age and condition of the roof, heating system, and air conditioning system?
Are there any known issues with the plumbing or electrical systems?
Has the property ever experienced any flooding or water damage?
What is the admin's timeline for accepting an offer and closing the sale?
Educational suggestions only. Consult licensed real estate professionals, home inspectors, and your agent for professional guidance on property tours and inspections.
Property Discussion
Start the Conversation
Share your insights on this property—did you visit the open house? Know of any hidden pros or cons? Your street-level knowledge could be exactly what another buyer needs.
Analyze Any Property for Free
Get instant insights and potential savings on any Zillow listing.