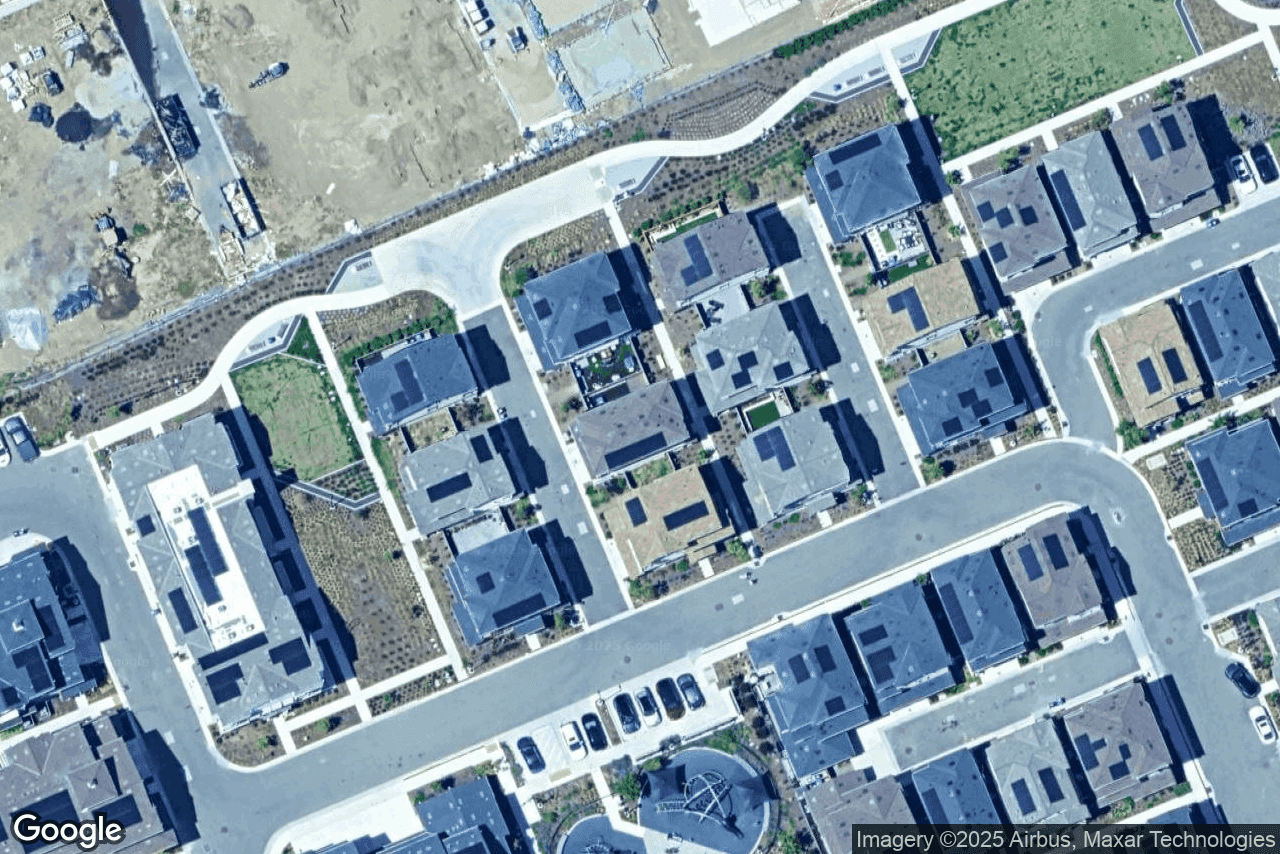
36202 Worthing Dr
Educational Use Only — NOT an appraisal or professional advice. — NOT professional advice. See terms
Property Overview
Price Analysis
How the list price compares to AI estimate
List Price
$1,550,000
AI estimates this property's value between $1,450,000 - $1,550,000 based on comparable sales and condition (Confidence: 75%). Educational analysis only, not a professional appraisal or valuation.
Market Data Points
3 data points for educational exploration
*Educational market data analysis only. Consult licensed real estate professionals for negotiation strategies and market advice.*
Offer Analysis
AI-generated starting point for educational purposes
AI Suggested Starting Point
Lands near the middle of recent sale outcomes observed between $1,450,000 and $1,550,000.
How This Was Calculated
Reflects fair market value considering needed repairs and market conditions. Seller motivation is present due to price reductions and cooling market.
AI-generated educational analysis. Not professional advice, an appraisal, or a recommended offer. Consult licensed agents and attorneys for negotiation strategies.
*AI scoring for educational purposes only. Scores are subjective and not professional evaluations. Consult licensed professionals for property assessments.*
Visual Insights
AI-analyzed spaces with reimagining capabilities

Dated Kitchen Cabinets
The kitchen cabinets appear dated and worn, with a less desirable wood finish.

Painted Brick Fireplace
The brick fireplace appears painted, which can be difficult to reverse and may indicate underlying issues.
Renovation Assessment
Prioritized renovations based on property inspection and market impact.
High Priority Renovations
Kitchen Renovation
Note: these are rough estimates. For more accurate estimates, please contact a professional.
Ownership History
Previous ownership changes and transaction details
Pricing History
Historical pricing trends for this property
Monthly Costs
Interactive breakdown of estimated monthly expenses
Upfront Transaction Costs
Estimated costs due at closing, including down payment and fees
* Estimated costs based on typical rates. Actual costs may vary by location, lender, and transaction details.
** Buyer agent fees are negotiable and may sometimes be covered by the seller.
Buyer Power Index
*Market analysis for educational purposes only. Historical data may not predict future performance. Consult real estate professionals for market guidance.*
Price Trajectory
Historical price trends for educational purposes only. Past performance does not predict future results. Consult professionals for market forecasts.
Historical Market Pulse
Key metrics over time, revealing market momentum and patterns
Negotiation Insight
Days on market decreasing 13.3% over the past 3 months suggests stronger seller position.
Subject Property
Stats in the Area
Based on 6 comparable properties nearby
Average Price
$2,011,042
Your price is 22.9% below average
Median Price
$2,200,000
Based on 6 recent sales
Price per Sq.Ft
$924
Your price is 22.0% below average $/sqft
Comparable Properties
| Address | Price | Sq.Ft | Beds | Baths | $/Sq.Ft | Sale Date |
|---|---|---|---|---|---|---|
| 36125 Fanshawe Ct, Fremont, CA 94536 | $2,200,000 | 2,160 | 4 | 3 | $1,01941.3% | 6/30/2025 |
| 35494 Blackburn Dr, Newark, CA 94560 | $1,760,000 | 2,228 | 4 | 3 | $7909.6% | 5/2/2025 |
| 4433 Cordova Pl, Fremont, CA 94536 | $2,271,250 | 2,326 | 5 | 3 | $97635.4% | 5/1/2025 |
| 36164 Mangrove Lane, Newark, CA 94560 | $1,810,000 | 2,059 | 4 | 3 | $87921.9% | 3/27/2025 |
| 35375 Severn Dr, Newark, CA 94560 | $1,740,000 | 2,403 | 4 | 3 | $7240.4% | 4/18/2025 |
| 3585 Surry Place, Fremont, CA 94536 | $2,285,000 | 1,980 | 4 | 3 | $1,15460.1% | 4/2/2025 |
Schools
Nearby school quality by education level
Elementary
Middle
High
Climate Risks
Assessment of climate-related hazards for this property
Moderate Risk Profile
This property has 0 severe, 0 major, and 2 moderate risk factors
Climate risk data is based on historical patterns and projections. Consider consulting with insurance providers and local experts for property-specific assessments.
Safety Analysis
Based on data from Newark Police Department
Crime Rate Comparison
Recent Crime Trends
Sunlight Analysis
Data provided by Shadowmap
Loading sunlight data...
Educational Tour Ideas
Educational suggestions for property tours
Inspect the pool and hot tub thoroughly, checking for cracks, leaks, and the condition of the pump and filter system.
Check for any signs of water damage or leaks around the updated bathrooms, including ceilings below and adjacent walls.
Examine the foundation for cracks, settling, or signs of water intrusion, especially given the moderate flood risk.
Educational Questions
Sample questions for educational purposes
Can you provide documentation for the "much more" updates mentioned in the listing, beyond the kitchen and bathrooms?
What is the age of the pool equipment (pump, filter, heater) and when was the pool last serviced?
Why was the property taken off the market multiple times in the past few years?
Educational suggestions only. Consult licensed real estate professionals, home inspectors, and your agent for professional guidance on property tours and inspections.
Property Discussion
Start the Conversation
Share your insights on this property—did you visit the open house? Know of any hidden pros or cons? Your street-level knowledge could be exactly what another buyer needs.
Analyze Any Property for Free
Get instant insights and potential savings on any Zillow listing.