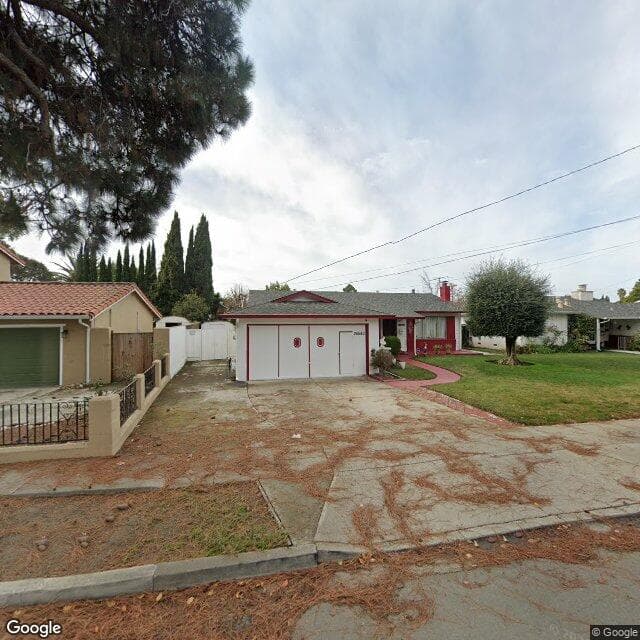
9263 Vista Cove Way
Educational Use Only — NOT an appraisal or professional advice. — NOT professional advice. See terms
Property Overview
Price Analysis
How the list price compares to AI estimate
List Price
$1,420,000
AI estimates this property's value between $1,257,124 - $1,420,000 based on comparable sales and condition (Confidence: 76%). Educational analysis only, not a professional appraisal or valuation.
Market Data Points
3 data points for educational exploration
*Educational market data analysis only. Consult licensed real estate professionals for negotiation strategies and market advice.*
Offer Analysis
AI-generated starting point for educational purposes
AI Suggested Starting Point
Targets the lower end of recent sale outcomes observed between $1,257,124 and $1,420,000.
How This Was Calculated
The offer reflects the fair value band after subtracting quantifiable repair costs, the per‑sqft premium, and the DOM penalty, while modestly accounting for multiple‑offer pressure. It positions the buyer competitively yet conservatively in a market where price declines and extended listing time suggest seller willingness to negotiate.
Quantitative drivers
- Extended days on market-$76,233
56 DOM vs area average 17.5.
- $/sqft premium vs comps-$66,871
Subject lists 29% above nearby sales on a per-sqft basis.
- Multiple-offer pressure+$8,845
3.2 average offers per listing in this market.
AI-generated educational analysis. Not professional advice, an appraisal, or a recommended offer. Consult licensed agents and attorneys for negotiation strategies.
*AI scoring for educational purposes only. Scores are subjective and not professional evaluations. Consult licensed professionals for property assessments.*
Visual Insights
AI-analyzed spaces with reimagining capabilities

Carpet
Carpet appears dated and could be updated to increase appeal.
Renovation Assessment
Prioritized renovations based on property inspection and market impact.
High Priority Renovations
No required renovations identified
Note: these are rough estimates. For more accurate estimates, please contact a professional.
Pricing History
Historical pricing trends for this property
Monthly Costs
Interactive breakdown of estimated monthly expenses
Upfront Transaction Costs
Estimated costs due at closing, including down payment and fees
* Estimated costs based on typical rates. Actual costs may vary by location, lender, and transaction details.
** Buyer agent fees are negotiable and may sometimes be covered by the seller.
Buyer Power Index
*Market analysis for educational purposes only. Historical data may not predict future performance. Consult real estate professionals for market guidance.*
Price Trajectory
Historical price trends for educational purposes only. Past performance does not predict future results. Consult professionals for market forecasts.
Historical Market Pulse
Key metrics over time, revealing market momentum and patterns
Negotiation Insight
Days on market increasing 107.7% over the past 3 months suggests growing buyer leverage.
Subject Property
Stats in the Area
Based on 6 comparable properties nearby
Average Price
$1,136,500
Your price is 24.9% above average
Median Price
$1,230,000
Based on 6 recent sales
Price per Sq.Ft
$636
Your price is 28.5% above average $/sqft
Comparable Properties
| Address | Price | Sq.Ft | Beds | Baths | $/Sq.Ft | Sale Date |
|---|---|---|---|---|---|---|
| 8536 Jetty Way, Newark, CA 94560 | $1,230,000 | 1,634 | 3 | 4 | $7537.9% | 9/5/2025 |
| 8556 Tailwind Ave, Newark, CA 94560 | $1,200,000 | 1,885 | 3 | 4 | $63722.1% | 8/22/2025 |
| 37456 Sand Drift Rd, Newark, CA 94560 | $1,400,000 | 1,984 | 3 | 4 | $70613.7% | 7/18/2025 |
| 36985 Walnut Street, Newark, CA 94560 | $699,000 | 1,959 | 4 | 3 | $35756.4% | 9/28/2025 |
| 8503 Mahogany Pl, Newark, CA 94560 | $1,430,000 | 1,856 | 4 | 3 | $7705.8% | 8/20/2025 |
| 37413 Bowline Road, Newark, CA 94560 | $860,000 | 1,443 | 2 | 3 | $59627.1% | 9/19/2025 |
Schools
Details about nearby schools in this area
Climate Risks
Assessment of climate-related hazards for this property
Moderate Risk Profile
This property has 0 severe, 0 major, and 2 moderate risk factors
Climate risk data is based on historical patterns and projections. Consider consulting with insurance providers and local experts for property-specific assessments.
Safety Analysis
Based on data from Newark Police Department
Crime Rate Comparison
Recent Crime Trends
Sunlight Analysis
Data provided by Shadowmap
Loading sunlight data...
Educational Tour Ideas
Educational suggestions for property tours
Check all windows and doors for proper sealing and drafts.
Test all electrical outlets and light switches to ensure they are functioning correctly.
Inspect the HVAC system (both heating and cooling) for proper operation and maintenance.
Check the foundation for cracks or signs of settling.
Educational Questions
Sample questions for educational purposes
Can you provide documentation for the fully paid solar panel system, including warranty information, production history, and any maintenance records?
What is the typical monthly electricity bill after the solar panels were installed?
Are there any known issues with the HOA or upcoming special assessments?
Educational suggestions only. Consult licensed real estate professionals, home inspectors, and your agent for professional guidance on property tours and inspections.
Property Discussion
Start the Conversation
Share your insights on this property—did you visit the open house? Know of any hidden pros or cons? Your street-level knowledge could be exactly what another buyer needs.
Analyze Any Property for Free
Get instant insights and potential savings on any Zillow listing.