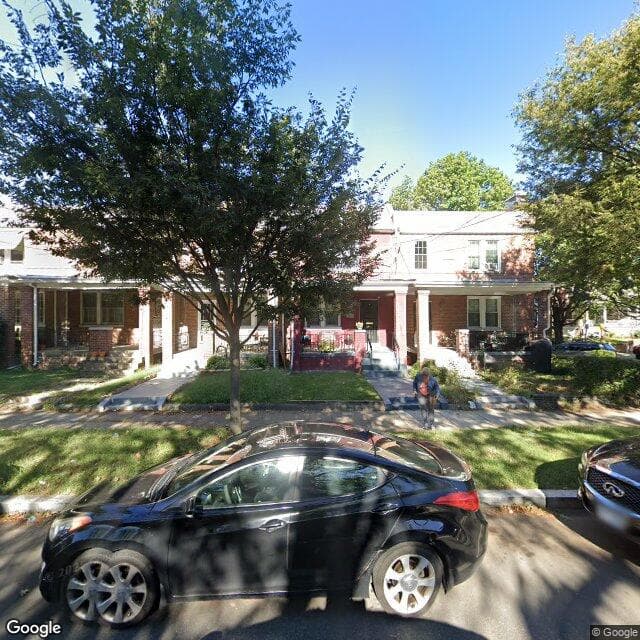
712 Varnum St NW
Educational Use Only — NOT an appraisal or professional advice. — NOT professional advice. See terms
Property Overview
Price Analysis
How the list price compares to AI estimate
List Price
$675,000
AI estimates this property's value between $652,000 - $680,000 based on comparable sales and condition (Confidence: 75%). Educational analysis only, not a professional appraisal or valuation.
Market Data Points
4 data points for educational exploration
*Educational market data analysis only. Consult licensed real estate professionals for negotiation strategies and market advice.*
Offer Analysis
AI-generated starting point for educational purposes
AI Suggested Starting Point
Targets the lower end of recent sale outcomes observed between $652,000 and $680,000.
How This Was Calculated
The offer reflects the fair market value adjusted for necessary repairs and considers the seller's likely motivation due to extended DOM. The cooling market trend also supports this strategy.
AI-generated educational analysis. Not professional advice, an appraisal, or a recommended offer. Consult licensed agents and attorneys for negotiation strategies.
*AI scoring for educational purposes only. Scores are subjective and not professional evaluations. Consult licensed professionals for property assessments.*
Limited Market Data Available
We recommend obtaining a professional appraisal from a licensed appraiser for an accurate property valuation.
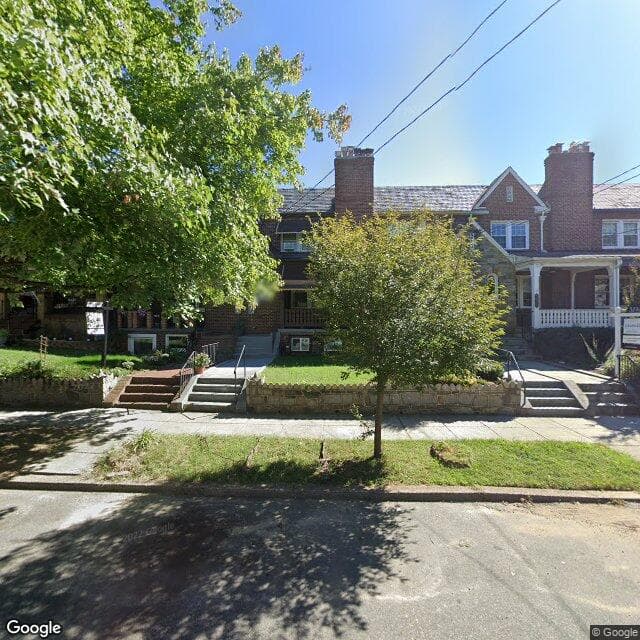
Visual Insights
AI-analyzed spaces with reimagining capabilities
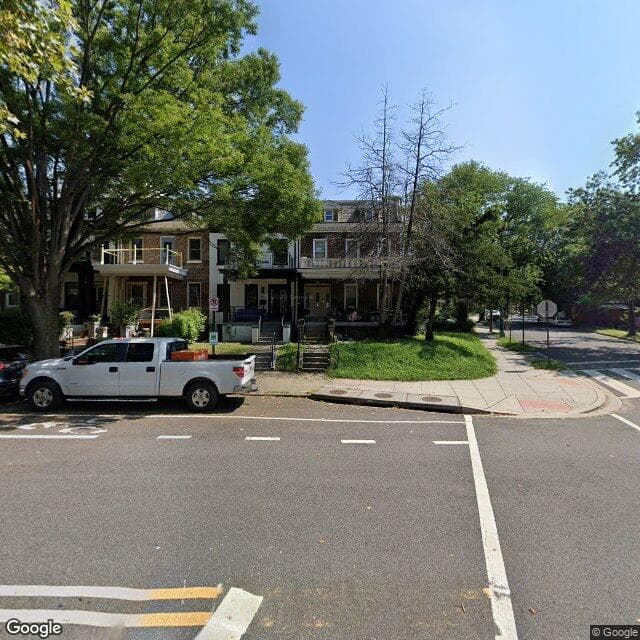
Renovation Assessment
Prioritized renovations based on property inspection and market impact.
High Priority Renovations
Repair or Replace Concrete Stairs
Note: these are rough estimates. For more accurate estimates, please contact a professional.
Ownership History
Previous ownership changes and transaction details
Pricing History
Historical pricing trends for this property
Monthly Costs
Interactive breakdown of estimated monthly expenses
Upfront Transaction Costs
Estimated costs due at closing, including down payment and fees
* Estimated costs based on typical rates. Actual costs may vary by location, lender, and transaction details.
** Buyer agent fees are negotiable and may sometimes be covered by the seller.
Buyer Power Index
*Market analysis for educational purposes only. Historical data may not predict future performance. Consult real estate professionals for market guidance.*
Price Trajectory
Historical price trends for educational purposes only. Past performance does not predict future results. Consult professionals for market forecasts.
Historical Market Pulse
Key metrics over time, revealing market momentum and patterns
Negotiation Insight
Home sales increasing 26.6% over the past 3 months suggests stronger seller position.
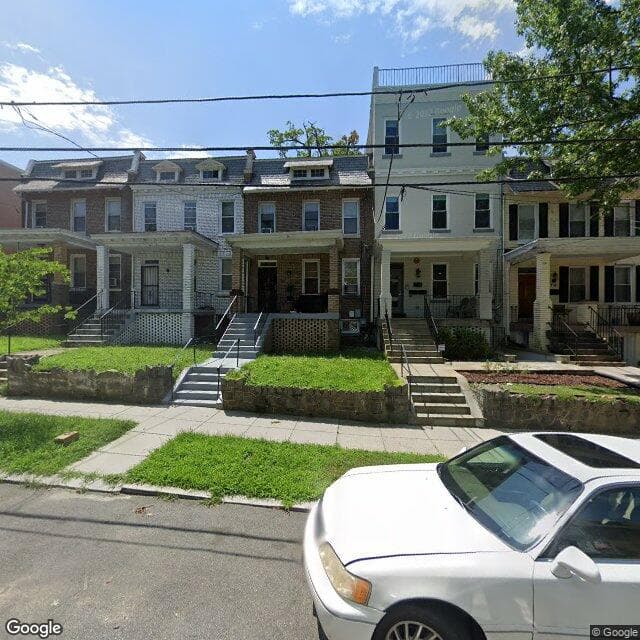
Subject Property
Stats in the Area
Based on 6 comparable properties nearby
Average Price
$812,500
Your price is 16.9% below average
Median Price
$900,000
Based on 6 recent sales
Price per Sq.Ft
$376
Your price is 21.5% below average $/sqft
Comparable Properties
| Address | Price | Sq.Ft | Beds | Baths | $/Sq.Ft | Sale Date |
|---|---|---|---|---|---|---|
| 1108 LAMONT ST NW, WASHINGTON, DC 20010 | $905,000 | 2,300 | 4 | 3 | $39333.4% | 7/16/2025 |
| 725 KENYON ST NW #1, WASHINGTON, DC 20010 | $960,000 | 2,023 | 3 | 3 | $47560.9% | 6/30/2025 |
| 217 JEFFERSON ST NW, WASHINGTON, DC 20011 | $500,000 | 1,972 | 3 | 3 | $25414.1% | 6/12/2025 |
| 3632 10TH ST NW, WASHINGTON, DC 20010 | $900,000 | 2,199 | 3 | 3 | $40938.7% | 5/1/2025 |
| 5005 3RD ST NW, WASHINGTON, DC 20011 | $715,000 | 2,143 | 3 | 3 | $33413.1% | 4/24/2025 |
| 1315 SHEPHERD ST NW, WASHINGTON, DC 20011 | $895,000 | 2,272 | 4 | 3 | $39433.5% | 4/3/2025 |
Schools
Nearby school quality by education level
Elementary
Middle
High
Neighborhood Mobility
How easily you can get around with or without a car
Walk Score®
Very Walkable
Score measures pedestrian-friendliness based on distances to amenities.
Scores are out of 100. Higher scores indicate better accessibility. Data provided by Walk Score®.
Climate Risks
Assessment of climate-related hazards for this property
Major Risk Profile
This property has 0 severe, 2 major, and 2 moderate risk factors
Climate risk data is based on historical patterns and projections. Consider consulting with insurance providers and local experts for property-specific assessments.
Sunlight Analysis
Data provided by Shadowmap
Loading sunlight data...
Educational Tour Ideas
Educational suggestions for property tours
Inspect the concrete stairs leading to the entrance for cracks, crumbling, and stability. Pay close attention to the handrail (if present) for sturdiness.
Thoroughly inspect the roof for any signs of damage, such as missing or cracked shingles, sagging, or discoloration. Check the gutters and downspouts for proper drainage and any signs of rust or damage.
Check the basement for any signs of water damage, such as stains, mold, or musty odors. Pay close attention to the walls and floors for cracks or signs of water seepage.
Educational Questions
Sample questions for educational purposes
Can you provide documentation of any roof repairs or replacements that have been done in the past, including the dates and scope of work?
Has the property experienced any flooding or water damage in the past, and if so, what measures were taken to remediate the damage and prevent future occurrences?
What is the age of the heating system (hot water and natural gas), and when was it last serviced?
Educational suggestions only. Consult licensed real estate professionals, home inspectors, and your agent for professional guidance on property tours and inspections.
Property Discussion
Start the Conversation
Share your insights on this property—did you visit the open house? Know of any hidden pros or cons? Your street-level knowledge could be exactly what another buyer needs.
Analyze Any Property for Free
Get instant insights and potential savings on any Zillow listing.