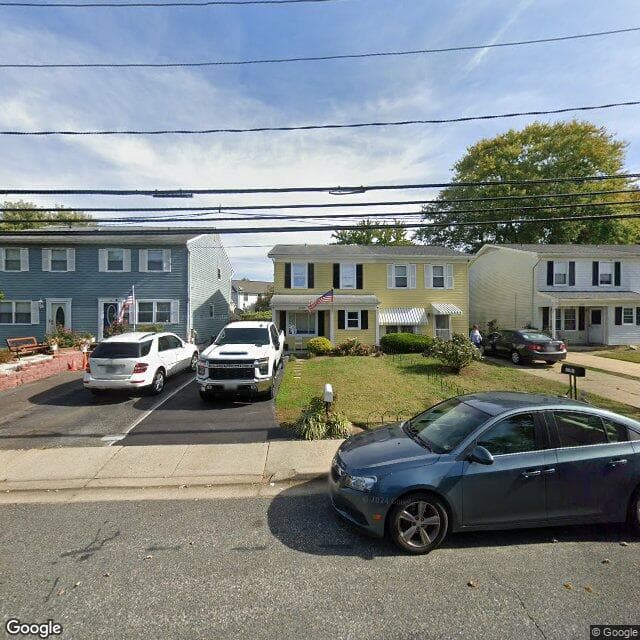
6 Victor Pkwy
Educational Use Only — NOT an appraisal or professional advice. — NOT professional advice. See terms
Property Overview
Price Analysis
How the list price compares to AI estimate
List Price
$374,900
AI estimates this property's value between $332,940 - $383,060 based on comparable sales and condition (Confidence: 76%). Educational analysis only, not a professional appraisal or valuation.
Market Data Points
3 data points for educational exploration
*Educational market data analysis only. Consult licensed real estate professionals for negotiation strategies and market advice.*
Offer Analysis
AI-generated starting point for educational purposes
AI Suggested Starting Point
Targets the lower end of recent sale outcomes observed between $332,940 and $383,060.
How This Was Calculated
The offer reflects the midpoint of the educational range after subtracting $3,000 for visible repairs, an $18,595 per‑sqft premium adjustment, a $4,240 sale‑to‑list trend discount, and the $6,547 recent price‑cut allowance. Combined with the buyer‑friendly market (98% sale‑to‑list ratio, low competition) and the property's short 12‑day DOM, this price balances fair value with identified risk adjustments.
Quantitative drivers
- $/sqft premium vs comps-$18,595
Subject lists 18% above nearby sales on a per-sqft basis.
- Recent price reduction-$6,547
Latest price cut of 6.3%.
- Area sale-to-list trend-$4,240
Typical sales closing at 98.0% of asking.
AI-generated educational analysis. Not professional advice, an appraisal, or a recommended offer. Consult licensed agents and attorneys for negotiation strategies.
*AI scoring for educational purposes only. Scores are subjective and not professional evaluations. Consult licensed professionals for property assessments.*
Visual Insights
AI-analyzed spaces with reimagining capabilities

Carpet
The carpet appears to be worn and outdated. Replacing it would improve the look of the rooms.

Overgrown Yard
The yard is overgrown and needs landscaping. This detracts from the curb appeal of the house.

Exterior Paint
The exterior paint appears to be faded. A fresh coat of paint would improve the look of the house.
Renovation Assessment
Prioritized renovations based on property inspection and market impact.
High Priority Renovations
No required renovations identified
Note: these are rough estimates. For more accurate estimates, please contact a professional.
Pricing History
Historical pricing trends for this property
Monthly Costs
Interactive breakdown of estimated monthly expenses
Upfront Transaction Costs
Estimated costs due at closing, including down payment and fees
* Estimated costs based on typical rates. Actual costs may vary by location, lender, and transaction details.
** Buyer agent fees are negotiable and may sometimes be covered by the seller.
Buyer Power Index
*Market analysis for educational purposes only. Historical data may not predict future performance. Consult real estate professionals for market guidance.*
Price Trajectory
Historical price trends for educational purposes only. Past performance does not predict future results. Consult professionals for market forecasts.
Historical Market Pulse
Key metrics over time, revealing market momentum and patterns
Negotiation Insight
Days on market increasing 49.1% over the past 3 months suggests growing buyer leverage.
Subject Property
Stats in the Area
Based on 6 comparable properties nearby
Average Price
$347,067
Your price is 8.0% above average
Median Price
$380,000
Based on 6 recent sales
Price per Sq.Ft
$349
Your price is 17.8% above average $/sqft
Comparable Properties
| Address | Price | Sq.Ft | Beds | Baths | $/Sq.Ft | Sale Date |
|---|---|---|---|---|---|---|
| 796 FAIRVIEW AVE #796 E, ANNAPOLIS, MD 21403 | $380,000 | 1,000 | 2 | 1 | $3807.6% | 6/20/2025 |
| 1000 HYDE PARK DR, ANNAPOLIS, MD 21403 | $524,900 | 984 | 3 | 2 | $53329.8% | 9/9/2025 |
| 203 VICTOR PKWY #203A, ANNAPOLIS, MD 21403 | $260,000 | 949 | 2 | 2 | $27433.4% | 8/10/2025 |
| 797 FAIRVIEW AVE #797 B, ANNAPOLIS, MD 21403 | $380,000 | 1,058 | 2 | 2 | $35912.6% | 9/7/2025 |
| 1006 PRIMROSE RD #302, ANNAPOLIS, MD 21403 | $297,500 | 1,004 | 2 | 2 | $29627.9% | 8/5/2025 |
| 204 VICTOR PKWY #204E, ANNAPOLIS, MD 21403 | $240,000 | 962 | 2 | 2 | $24939.3% | 7/11/2025 |
Schools
Details about nearby schools in this area
Climate Risks
Assessment of climate-related hazards for this property
Major Risk Profile
This property has 0 severe, 1 major, and 3 moderate risk factors
Climate risk data is based on historical patterns and projections. Consider consulting with insurance providers and local experts for property-specific assessments.
Sunlight Analysis
Data provided by Shadowmap
Loading sunlight data...
Educational Tour Ideas
Educational suggestions for property tours
Inspect the foundation for cracks, water stains, or signs of settling, especially given the flood risk and sloped terrain.
Check the gas oven/range for proper operation, including ignition, flame color, and gas leaks.
Inspect the roof for missing or damaged shingles, and look for signs of leaks or water damage in the attic.
Look for signs of mold or mildew in bathrooms, kitchens, and basements.
Educational Questions
Sample questions for educational purposes
Can you provide documentation for the recent interior updates, including permits and warranties for the kitchen renovation and bathroom refresh?
Has the property experienced any water damage or flooding in the past, considering the major flood risk identified in the climate risk assessment?
Educational suggestions only. Consult licensed real estate professionals, home inspectors, and your agent for professional guidance on property tours and inspections.
Property Discussion
Start the Conversation
Share your insights on this property—did you visit the open house? Know of any hidden pros or cons? Your street-level knowledge could be exactly what another buyer needs.
Analyze Any Property for Free
Get instant insights and potential savings on any Zillow listing.